Debugging Hotwire Native Part 5 - Breakpoints
Welcome to the final post on debugging Hotwire Native iOS and Hotwire Native Android applications. We have covered everything from obvious questions to ask to logging, webview debugging and now we’re finishing with breakpoints.
Both Xcode and Android Studio have powerful debuggers that suspend the program, allowing you to inspect different objects and variables at that point of suspension.
Let’s start by using breakpoints with Android Studio and finish up with Xcode.
Using the Debugger in Android Studio
Prerequisites
Ensure that debuggable is set to true in the app/build.gradle(app level).
  getByName("debug") {
            isDebuggable = true
            applicationIdSuffix = ".debug"
            proguardFiles(getDefaultProguardFile("proguard-android.txt"), "proguard-rules.pro")
            ...
  }
Ensure that you have your emulator set up or that your physical Android phone has USB debugging enabled(found under Settings > System > Developer options).
Set Breakpoints
Now, click any line number to set a breakpoint. A red dot should appear above the line number.
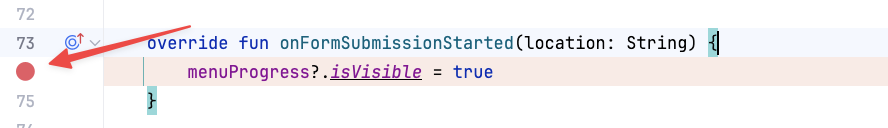
From here, you can even right-click the breakpoint to set conditions for when it should break, but this is optional.
Start Debugging
Click the Debug Button.

Android will now build and launch the app in debug mode, and when successful, a little bug icon will appear in the bottom-left of the editor.
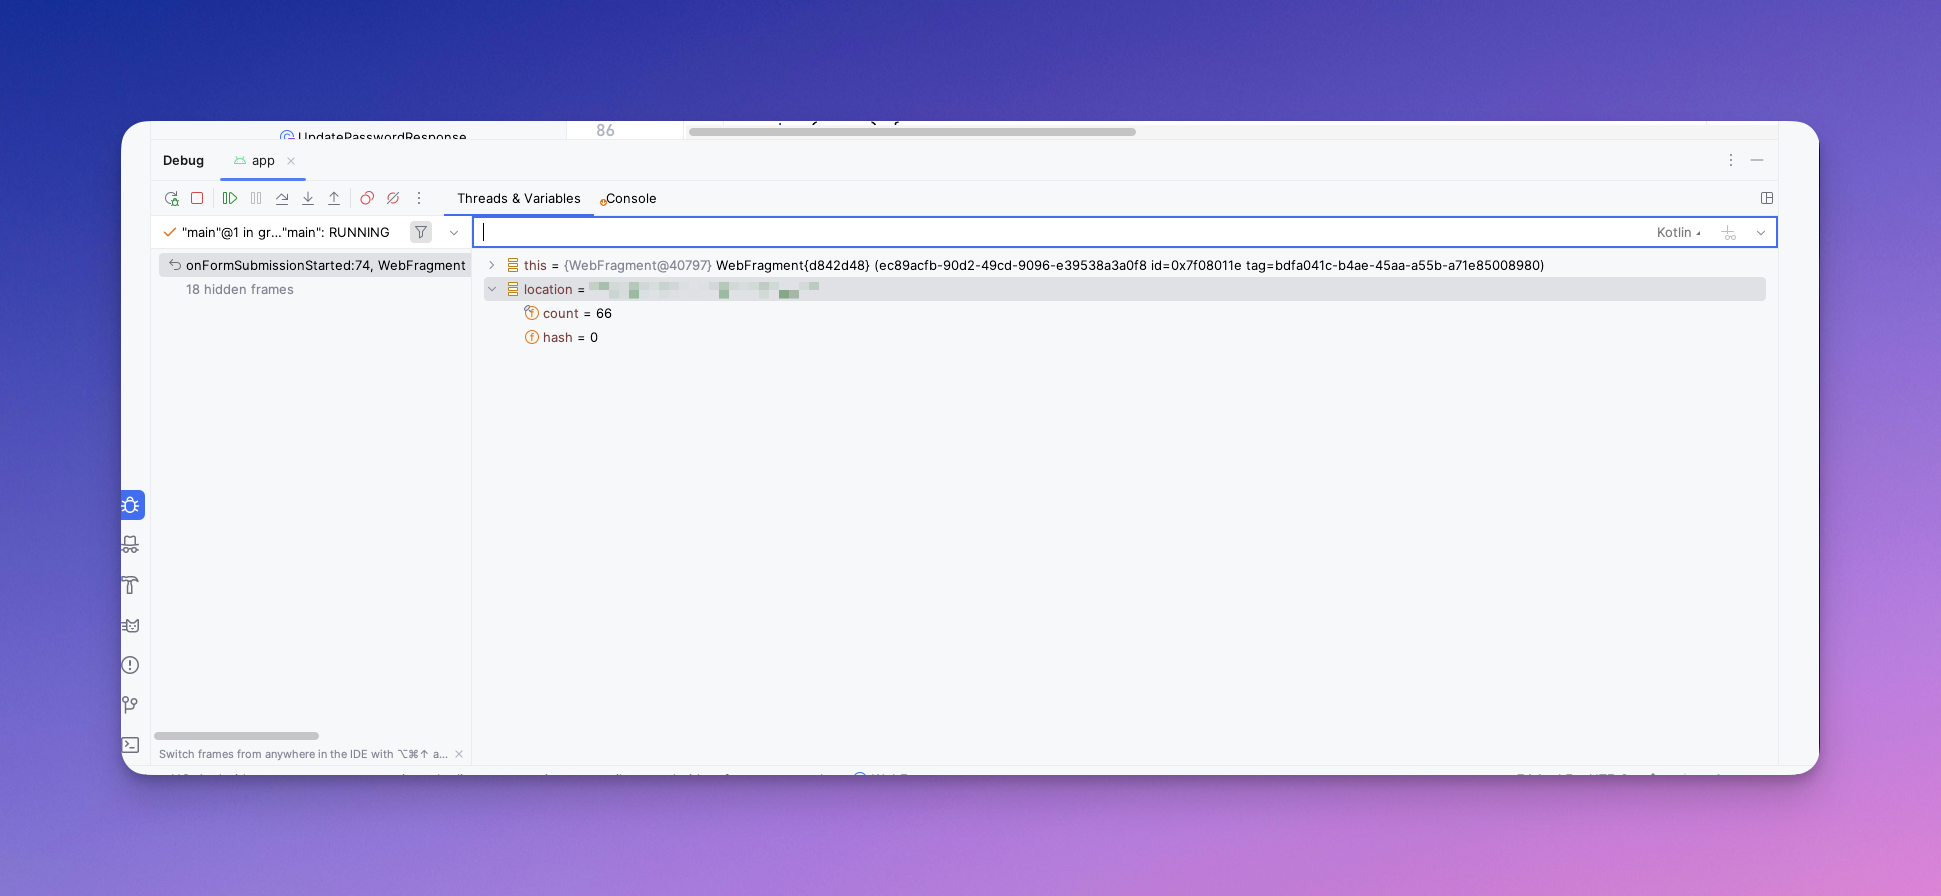
You can also execute code at this point, as well as some of the usual debugging tools, such as step over, into and out of functions. It even allows you to execute code at this point.
The debugger is powerful, and you can go quite deep. Since this article is aimed at Hotwire Native Developers who may be new to Android, I’ll stop here and briefly touch on Xcode.
Using the Debugger in Xcode
Prerequisites
Set Build Configuration to Debug
Xcode has reasonable defaults, but if the debugger is not working, do the following:
Go to Product > Scheme > Edit Scheme > Run tab > Info > Set Build Configuration to Debug (default for new projects).
Set Breakpoints
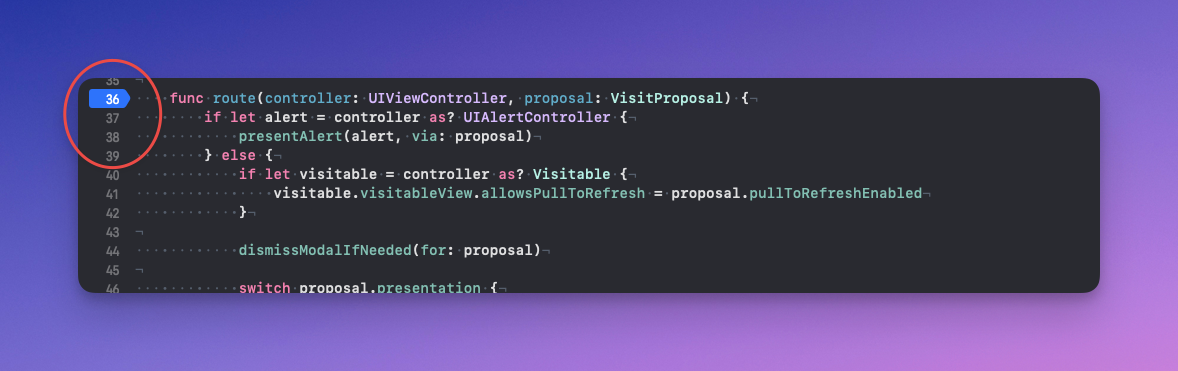
Now, click any line number to set a breakpoint. A blue arrow should appear.
Start Debugging
Run the app with CMD + R.
When the code execution reaches that breakpoint, the debug window opens at the bottom of Xcode.
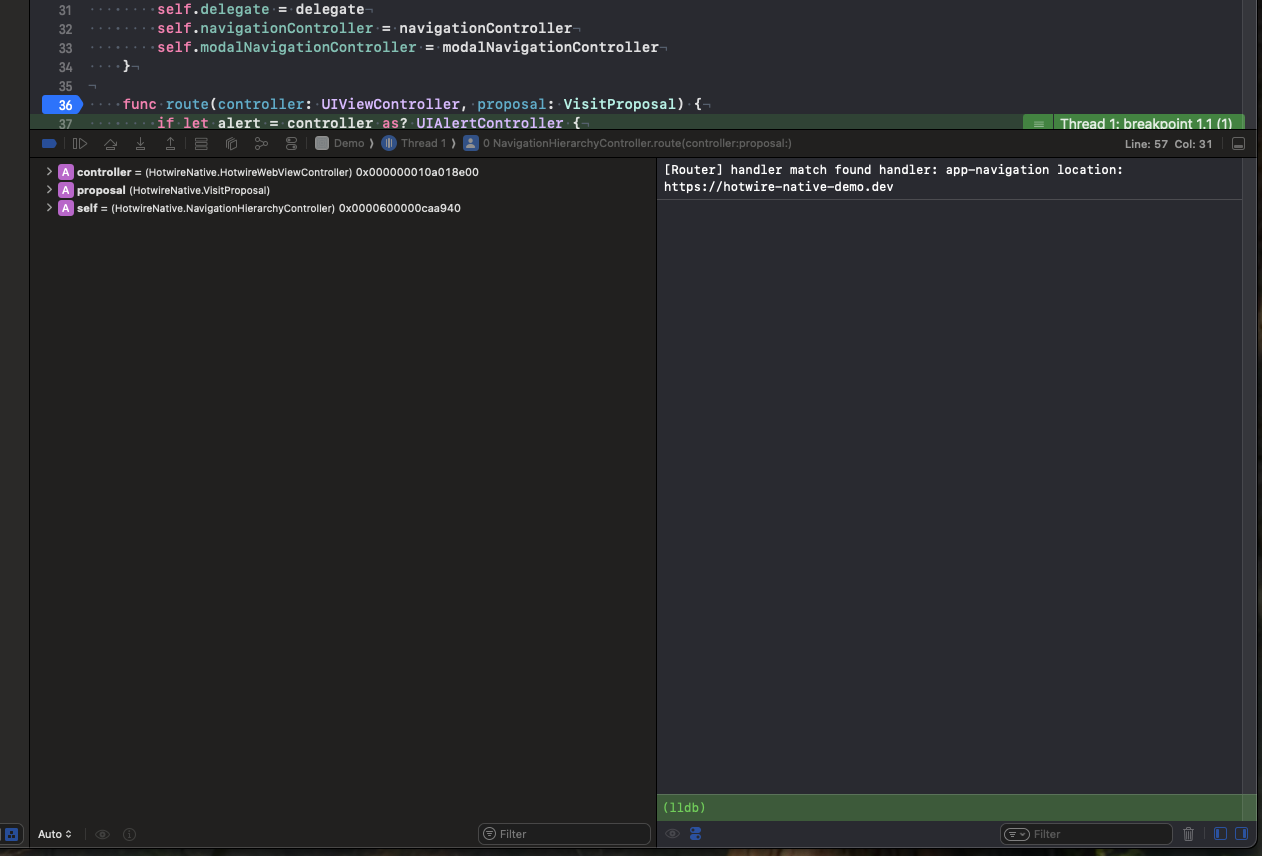
Here you can use the LLDB debugger to print objects po variable or execute code with expr variable = newValue.
It’s not as smooth or intuitive as the Android Debugger, but there are similarities. You can step over, into and out of functions. The tool is quite extensive, and this is where my article stops.
Are you Finally Debugged
Learning new frameworks and paradigms can be daunting, and native development is no exception. Hotwire Native is brilliant when things go right, but what about when things go wrong?
The knowledge you learned here should save you a few hours. When debugging, knowing what actions to take to get you closer to solving the mystery is all you need.
Happy hacking.