Debugging Hotwire Native - Native Logging
Welcome back to the Debugging Hotwire Native series, the series to help you when things go wrong. Today we’re talking about logs. Regardless of the programming language or framework I use, I always strive to keep logs within my line of sight.
This practice has come from over 10 years of working on 100’s of applications.
Working with Hotwire Native means that you must understand four different environments for your logs (potentially more, depending on your backend).
In Hotwire Native, logs come from the following places:
- Server
- JavaScript Logs
- iOS Logs
- Android Logs
In this article, we will mainly focus on iOS and Android, assuming the audience is primarily web developers.
Logging with Android Studio
Out of the box, Android has some great debugging tools and the system log is a great example. Combined with the logcat window, logging on Android is an incredibly polished experience.
For example, adding tags to different parts of your logs is quite intuitive.
But what do you mean by tags, William?
Tags are specific categories that you add to your log.
The syntax is as follows:
Log.e("TAG", message)
Note that we have Log.e, the “e” stands for error. There are also some others:
- Log.e -> error
- Log.d -> debug
- Log.i -> information
- Log.wtf -> What a terrible failure
We can open Logcat by clicking the following button.
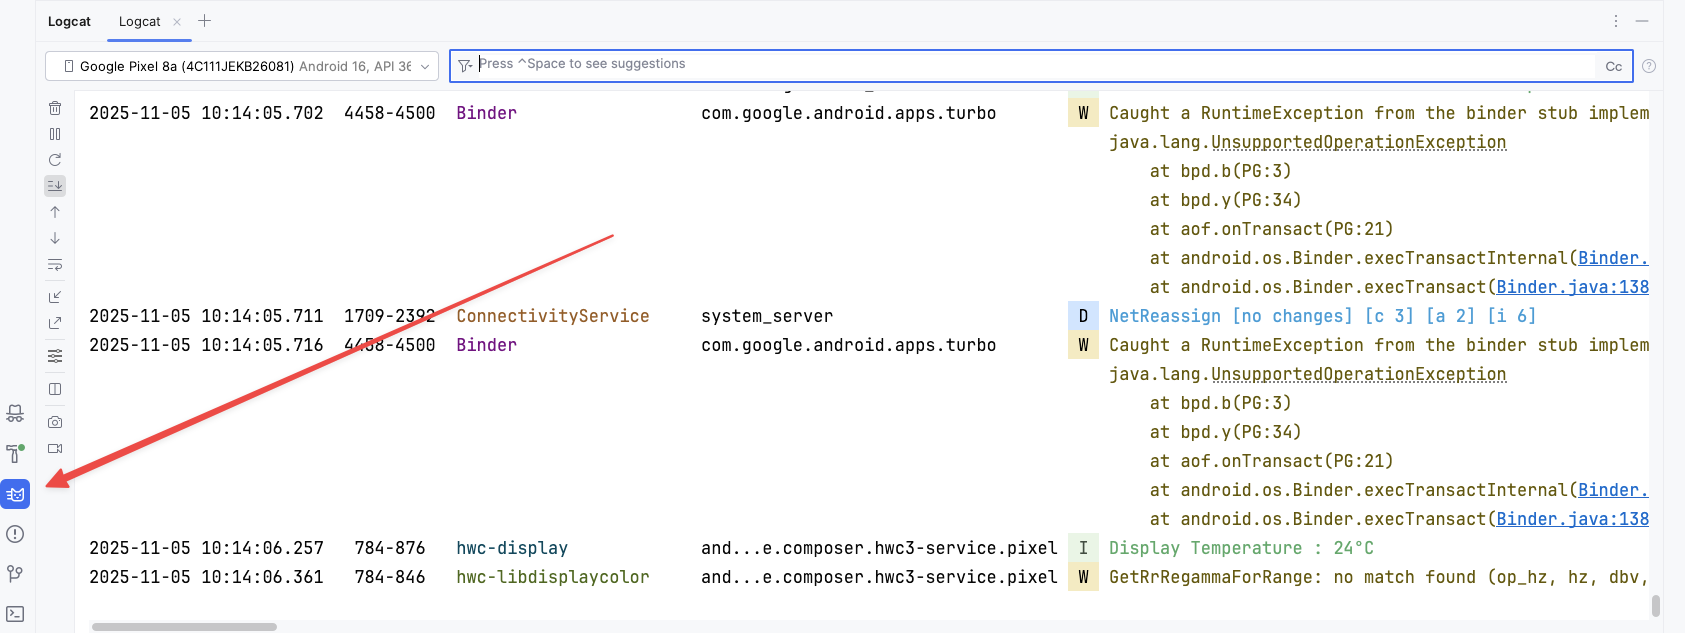
From there, you can press CTRL + Space in the search bar to see suggested searches or start filtering down yourself.
For example, here is a search that I perform frequently.
In my WebFragment class, I have the following:
@HotwireDestinationDeepLink(uri = "turbo://fragment/web")
open class WebFragment : HotwireWebFragment() {
    private val TAG = "WebFragment"

    override fun onStart() {
    super.onStart()
    Log.d(TAG, "calling onStart()")
    }
    ...
}
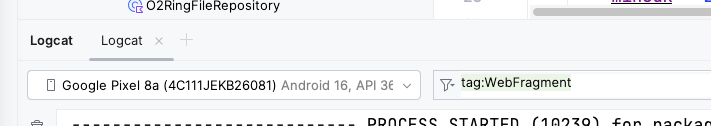
By searching for tag:WebFragment, I see this appear in the logs.
There are far more filters than tags.
For example, you can filter by package, process, message, level and age, plus add logical operators.
Although Android Development can be more cumbersome compared to iOS development, logging and debugging are incredibly powerful with Android Studio.
Logging with Xcode
After trying to use logs the “Apple Way”, I decided that it was better to have a unified debugging experience for both iOS and Android. This was motivated by my desire to reduce cognitive load when switching between the environments.
So in my iOS apps, I do the following:
import OSLog
extension Logger {
  private static var subsystem = Bundle.main.bundleIdentifier!
  static let connections = Logger(subsystem: subsystem, category: "Connections")   static let accounts = Logger(subsystem: subsystem, category: "Account")
}
Just note that in tests, you might have to do the following because bundleIdentifier could be nil:
subsystem = "com.example.fallback"
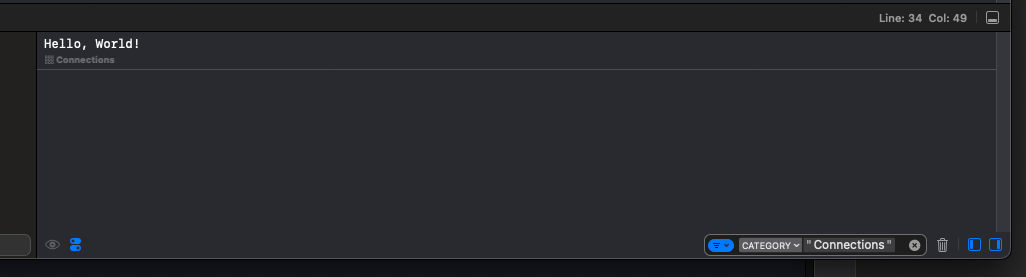
This means that I can now start filtering different logs by category, as seen here. You can find this filter located at the bottom-right of Xcode.
Now you can extend the logger as needed.
Hope this helps, happy hacking.