Debugging Hotwire Native - Start with the Obvious Questions
Once you have a good understanding of how Hotwire Native works, debugging problems gets much easier. However, to truly understand it, the best approach is to build a few apps. Spin up a repo that you can play around with and try things with.
At this stage, I’ve worked on at least 10 Hotwire Native apps—a combination of my own, new greenfield apps for clients and existing apps for clients. I have noticed some patterns emerging.
In my talk, I had one slide that covered the questions I asked myself, but I didn’t have time to delve into the details. Let’s rectify this.
Is Turbo JS installed?
I have encountered this problem most often with beginners. Many people don’t realise that TurboJS is a dependency. Both Hotwire iOS and Hotwire Android require TurboJS and use their own adapters to trigger native functionality.
To check if you’re app has TurboJS installed, visit it in a web browser, open the Web Console and type Turbo.
If you see the following, it means that Turbo is installed incorrectly.
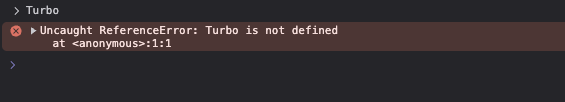
However, if you see the object printed to the console, it means that you are good to go.

Can you see any logs
A deceptively tricky question because you have to know where to look. With Hotwire Native, there is a plethora of logging options.
We have the following:
- Server logs
- Web Console logs
- iOS Logs
- Android Logs
Each is formatted differently. A future article will cover some logging techniques, but let’s start with some basics.
Server Logs
When booting your app and navigating around, you should see the server logs(if you have them enabled).
Both Laravel and Rails come with significant logging out of the gate. I have not used other frameworks with Hotwire Native, so I can’t comment.
The great thing about server logs is that they will tell you if there is a syntax issue with your path configuration or if you are connected to the right endpoint (as embarrassing as it is to admit, I do this all the time).
Enable logging
Both Hotwire Native iOS and Hotwire Native Android enable logging.
I’m going to cover how to navigate logs in a later article, but for now, all you need to do is the following in iOS:
Hotwire.config.debugLoggingEnabled = true
In Android:
Hotwire.config.debugLoggingEnabled = BuildConfig.DEBUG
Hotwire.config.webViewDebuggingEnabled = BuildConfig.DEBUG
Web Console Logs
This will be covered in depth later, but you can connect to the Webview of the Hotwire Native app that you are running on. Here’s how.
iOS
First, you have to have the app running on a simulator.
Then you open up Safari and navigate to Safari > Develop > Simulator.
This option only shows up if you have made the webView configuration inspectable.
Android
To open the web console, you can navigate to’ chrome://inspect’ via the URL address bar. From there, you can connect to any webview that’s rendered.
What happens when you use a debugger
Four places where you can use a debugger:
- Rails debugger such as pry or binding.irb
- JavaScript debugger
- iOS breakpoint
- Android breakpoint
Getting to a stage where you can execute code when a programme is suspended. This is particularly useful when you want to check what values are being passed into a function or that the objects you expect to be there are there.
I’m one of those programmers who prefer logs to figure out what’s going on, but I will not deny the power of a good debugger.
Bridge Components - Are messages being sent
Debugging Bridge components can be particularly confusing at first, given the large number of moving parts.
This is specific to Bridge Components, but the first step when writing a bridge component is to ensure that it sends a message.
Please take a look at this pull request I did for Joe Masilotti’s Bridge Component.
import { BridgeComponent } from "@hotwired/hotwire-native-bridge"

export default class extends BridgeComponent {
  static component = "haptic"

  vibrate() {
    const element = this.bridgeElement
    const feedback = element.bridgeAttribute("feedback") || "success"
    this.send("vibrate", {feedback})
  }
}
While building this, after I wrote the JavaScript, the first step I took was to make sure a message was being sent. This is a simple matter of reading the logs in iOS and Android after you register your component.
Once I am confident that I’m receiving the messages, I can then move on to the next part.
Bridge Components - Are replies being received
Continuing the story of how I wrote the PR for the Haptic feedback, the second step is to ensure that messages are being received.
We have already touched on this, as you can review the logs, but we can also do a bit more.
lass HapticComponent(
    name: String,
    private val bridgeDelegate: BridgeDelegate<HotwireDestination>
) : BridgeComponent<HotwireDestination>(name, bridgeDelegate) {
    private val fragment: Fragment
        get() = bridgeDelegate.destination.fragment

    override fun onReceive(message: Message) {
        when (message.event) {
            "vibrate" -> Log.w("HapticComponent", "received event")
            else -> Log.w(
                "HapticComponent", "Unknown event for message: $message"
            )
        }
    }
    }
In Android Studio, we can now filter the logs using the tag filter, along with ‘tag:HapticComponent’, which will only display Haptic Component tags.
In iOS, we do something similar.
final class HapticComponent: BridgeComponent {
    override class var name: String { "haptic" }

    override func onReceive(message: Message) {
        guard let event = Event(rawValue: message.event) else { return }

        switch event {
        case .vibrate:
            print("HapticComponent")
        }
    }
}

private extension HapticComponent {
    enum Event: String {
        case vibrate
    }
}
Logging in to Xcode is not as advanced as Android, but in a later article, I’ll show some better tricks that can help.
Is the fragment or bridge component registered
This has happened to at least three people that I have paired with in the last two months. They write the component or fragment, then forget to register it in the Hotwire configuration object.
In iOS, registering Bridge Components looks like this.
class AppDelegate: UIResponder, UIApplicationDelegate {
    func application(_ application: UIApplication, didFinishLaunchingWithOptions launchOptions: [UIApplication.LaunchOptionsKey: Any]?) -> Bool {
        Hotwire.registerBridgeComponents([
            ButtonComponent.self
        ])
        return true
    }
}```


In Android, we must register both fragments and the bridge components so that they can be used.

```kotlin
Hotwire.registerBridgeComponents(
    BridgeComponentFactory("button", ::ButtonComponent)
)

Hotwire.registerFragmentDestinations(
    HotwireWebFragment::class,
    NumbersFragment::class
)
Is the Path Configuration configured correctly?
A simple syntax error in the JSON file can throw everything off. Visit the remote path configuration in the browser and ensure that you validate the JSON. Ensure it complies with the expected Path Configuration object as seen here.
Conclusion
Obvious questions to ask yourself emerge as you gain more experience. After a while, it becomes second nature to check the little misconfigurations that cost you hours. I hope this article saves you many of the hours that I have lost over the years.
Happy hacking.